
Canadian home sales post solid gain in November
Ottawa, ON, December 14, 2017 – According to statistics released today by The Canadian Real Estate Association (CREA), national home sales rose strongly in November 2017.
Highlights:
- National home sales rose 3.9% from October to November.
- Actual (not seasonally adjusted) activity was up 2.6% from November 2016.
- The number of newly listed homes climbed 3.5% from October to November.
- The MLS® Home Price Index (HPI) was up 9.3% year-over-year (y-o-y) in November 2017.
- The national average sale price edged up 2.9% y-o-y in November.
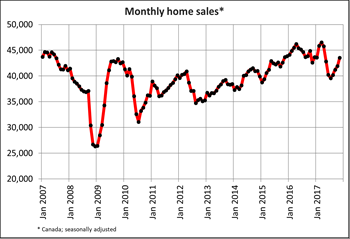
 Home sales via Canadian MLS® Systems rose for the fourth month in a row in November 2017, up 3.9% from October. Led by a 16% jump in sales in the Greater Toronto Area (GTA), the surge in sales there accounted for more than two-thirds of the national increase. The continuing rebound put November sales activity a little over halfway between the peak recorded in March 2017 and the low reached in July.
Actual (not seasonally adjusted) activity rose 2.6% y-o-y, setting a new record for the month of November. It was the first y-o-y increase since March and was unassisted by the GTA, where activity remains down significantly from year-ago levels. A number of other large markets posted y-o-y activity gains, including Greater Vancouver and the Fraser Valley, Calgary, Edmonton, Ottawa and Montreal.
“Some home buyers with more than a twenty percent down payment may be fast-tracking their purchase decision in order to beat the tougher mortgage qualifications test coming into effect next year,” said CREA President Andrew Peck. “Evidence of this is mixed and depends on the housing market. It will be interesting to see whether December sales show further signs of home purchases being fast-tracked. A professional REALTOR® is your best source for information and guidance in negotiations to purchase or sell a home during these changing times.”
“National sales momentum remains positive heading toward year-end,” said Gregory Klump, CREA’s Chief Economist. “It remains to be seen whether stronger momentum now will mean weaker activity early next year once new mortgage regulations take effect beginning on New Years day.”
The number of newly listed homes rose 3.5% in November, which reflected a large increase in new supply across the GTA.
With sales and new listings having risen by similar magnitudes, the national sales-to-new listings ratio was 56.4% in November, remaining little changed from 56.2% reported in October. A national sales-to-new listings ratio of between 40% and 60% is generally consistent with a balanced national housing market, with readings below and above this range indicating buyers’ and sellers’ markets respectively.
That said, the balanced range for the measure can vary among local markets. Considering the degree and duration that the current market balance is above or below its long-term average is a more sophisticated way of gauging whether local housing market conditions favour buyers or sellers. (Market balance measures that are within one standard deviation of the long-term average are generally consistent with balanced market conditions).
Based on a comparison of the sales-to-new listings ratio with its long-term average, more than half of all local markets were in balanced market territory in November 2017.
The number of months of inventory is another important measure of the balance between housing supply and demand. It represents how long it would take to liquidate current inventories at the current rate of sales activity.
There were 4.8 months of inventory on a national basis at the end of November 2017 – down slightly from 4.9 months in October and around 5 months recorded over the summer months, and within close reach of the long-term average of 5.2 months.
At 2.4 months, the number of months of inventory in the Greater Golden Horseshoe region is up sharply from the all-time low of 0.8 months reached in February and March. Even so, it remains below the region’s long-term average of 3.1 months.
 The Aggregate Composite MLS® HPI rose by 9.3% y-o-y in November 2017. This is a further deceleration in y-o-y gains that began in the spring and the smallest increase since February 2016.
The deceleration in price gains largely reflects softening price trends in the Greater Golden Horseshoe housing markets tracked by the index, particularly for single-family homes.
Apartment units again posted the largest y-o-y gains in November (+19.4%), followed by townhouse/row units (+12.3%), one-storey single family homes (+6%), and two-storey single family homes (+5.3%).
Benchmark home prices were up from year-ago levels in 11 of the 13 markets tracked by the MLS® HPI.
After having dipped in the second half of last year, benchmark home prices in the Lower Mainland of British Columbia have recovered and now stand at new highs (Greater Vancouver: +14% y-o-y; Fraser Valley: +18.5% y-o-y).
Benchmark home prices rose by about 14% on a y-o-y basis in Victoria and by 18.5% elsewhere on Vancouver Island in November, on par with y-o-y gains in October.
Price gains have slowed considerably on a y-o-y basis in Greater Toronto, Oakville-Milton and Guelph but remain above year-ago levels (Greater Toronto: +8.4% y-o-y; Oakville-Milton: +3.5% y-o-y; Guelph: +13.4% y-o-y).
Calgary benchmark home prices remained just inside positive territory on a y-o-y basis (+0.3%), while prices in Regina and Saskatoon were down from last November (-3.5% y-o-y and -4.1% y-o-y, respectively).
Benchmark home prices rose 6.7% y-o-y in Ottawa, led by a 7.6% increase in two-storey single family home prices, by 5.6% in Greater Montreal, led by an 8.3% increase in prices for townhouse/row units, and by 4.6% in Greater Moncton, led by a 7.8% increase in one-storey single family home prices. (Table 1)
The MLS® Home Price Index (MLS® HPI) provides the best way of gauging price trends because average price trends are prone to being strongly distorted by changes in the mix of sales activity from one month to the next.
The actual (not seasonally adjusted) national average price for homes sold in November 2017 was just under $504,000, up 2.9% from one year earlier. The national average price is heavily skewed by sales in Greater Vancouver and Greater Toronto, two of Canada’s most active and expensive markets. Excluding these two markets from calculations trims more than $120,000 from the national average price (to just above $381,000).
– 30 –
PLEASE NOTE: The information contained in this news release combines both major market and national sales information from MLS® Systems from the previous month.
CREA cautions that average price information can be useful in establishing trends over time, but does not indicate actual prices in centres comprised of widely divergent neighbourhoods or account for price differential between geographic areas. Statistical information contained in this report includes all housing types.
MLS® Systems are co-operative marketing systems used only by Canada’s real estate Boards to ensure maximum exposure of properties listed for sale.
The Canadian Real Estate Association (CREA) is one of Canada’s largest single-industry trade associations, representing more than 120,000 REALTORS® working through some 90 real estate Boards and Associations.
Further information can be found at http://crea.ca/statistics.
For more information, please contact:
Pierre Leduc, Media Relations
The Canadian Real Estate Asso

Leave a Reply
Want to join the discussion?Feel free to contribute!