
Canadian home sales edge higher in August
Ottawa, ON, September 16, 2019 – Statistics released today by the Canadian Real Estate Association (CREA) show national home sales were up in August 2019.
Highlights:
- National home sales rose 1.4% month-over-month (m-o-m) in August.
- Actual (not seasonally adjusted) activity was up 5% year-over-year (y-o-y).
- The number of newly listed homes climbed 1.1% m-o-m.
- The MLS® Home Price Index (HPI) advanced by 0.8% m-o-m and 0.9% y-o-y.
- The actual (not seasonally adjusted) national average sale price was up 3.9% y-o-y.

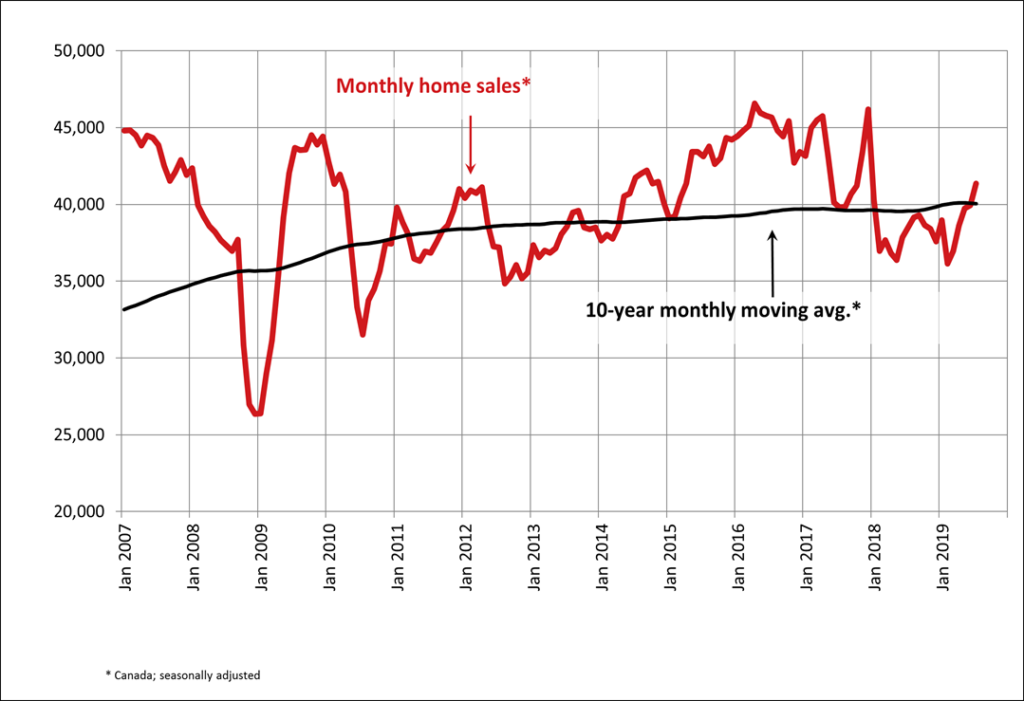
Home sales recorded via Canadian MLS® Systems advanced for the sixth consecutive month in August. Transactions are now running almost 17% above the six-year low reached in February 2019, but remain about 10% below highs reached in 2016 and 2017. (Chart A)
Activity was up in slightly more than half of all local markets, although monthly changes were generally modest across most of the country. Gains were led by a record-setting August in Winnipeg and a further improvement in the Fraser Valley. Moncton posted the biggest monthly decline in sales, returning to more normal levels after having recently jumped to record heights.
Actual (not seasonally adjusted) sales activity was up 5% from where it stood in August 2018. The number of homes that traded hands was up from year-ago levels in most of Canada’s largest urban markets, including the Lower Mainland of British Columbia, Calgary, Winnipeg, the Greater Toronto (GTA), Ottawa and Montreal.
“The mortgage stress-test has eased marginally and that’s helped some potential homebuyers,” said Jason Stephen, CREA’s President, “but the extent to which they’re adjusting to it continues to vary by community and price segment. All real estate is local. Nobody knows that better than a professional REALTOR®, your best source for information and guidance when negotiating the sale or purchase of a home,” said Stephen.
“The recent marginal decline in the benchmark five-year interest rate used to assess homebuyers’ mortgage eligibility, together with lower home prices in some markets, means that some previously sidelined homebuyers have returned,” said Gregory Klump, CREA’s Chief Economist. “Even so, the mortgage stress-test will continue to limit homebuyers’ access to mortgage financing, with the degree to which it further weighs on home sales activity continuing to vary by region.”
The number of newly listed homes rose 1.1% in August. With sales and new supply up by similar magnitudes, the national sales-to-new listings ratio was 60.1%—little changed from July’s reading of 60.0%. The measure has risen above its long-term average (of 53.6%) in recent months, which indicates a tighter balance between supply and demand and a growing potential for price gains.
Considering the degree and duration to which market balance readings are above or below their long-term averages is the best way of gauging whether local housing market conditions favour buyers or sellers. Market balance measures that are within one standard deviation of their long-term average are generally consistent with balanced market conditions.
Based on a comparison of the sales-to-new listings ratio with the long-term average, about three-quarters of all local markets were in balanced market territory in August 2019. Of the remainder, the ratio was above the long-term average in all markets save for some in the Prairie region.
The number of months of inventory is another important measure of the balance between sales and the supply of listings. It represents how long it would take to liquidate current inventories at the current rate of sales activity.
There were 4.6 months of inventory on a national basis at the end of August 2019 – the lowest level since December 2017. This measure of market balance has been increasingly retreating below its long-term average (of 5.3 months).
That said, national measures of market balance continue to mask significant regional variations. The number of months of inventory has swollen far beyond long-term averages in Prairie provinces and Newfoundland & Labrador, giving homebuyers ample choice in these regions. By contrast, the measure is running well below long-term averages in Ontario, Quebec and Maritime provinces, resulting in increased competition among buyers for listings and fertile ground for price gains. Meanwhile, the measure is well centred in balanced market territory in the Lower Mainland of British Columbia, making it likely that prices there will stabilize.

The Aggregate Composite MLS® Home Price Index (MLS® HPI) rose 0.8% m-o-m in August 2019, the largest increase in over 2 years. (Chart B)
Seasonally adjusted MLS® HPI readings in August were up from the previous month in 14 of the 18 markets tracked by the index, marking the biggest dispersion of monthly price gains since last March. (Table 1)
In recent months, home prices have generally been stabilizing in British Columbia and the Prairies, a measure which had been falling until recently. Meanwhile, price growth has begun to rebound among markets in the Greater Golden Horseshoe (GGH) region amid ongoing price gains in housing markets east of it.
A comparison of home prices to year-ago levels yields considerable variations across the country, with declines in western Canada and price gains in eastern Canada.
The actual (not seasonally adjusted) Aggregate Composite MLS® (HPI) was up 0.9% y-o-y in August 2019. This marks the second consecutive month in which prices climbed above year-ago levels and the largest y-o-y increase since the end of last year.
Home prices in Greater Vancouver (GVA) and the Fraser Valley remain furthest below year-ago levels, (-8.3% and -5.5%, respectively), while Vancouver Island and the Okanagan Valley logged y-o-y increases (3.7% and 1.5% respectively).
Prairie markets posted modest price declines, while y-o-y price growth has re-accelerated ahead of overall consumer price inflation across most of the GGH. Meanwhile, price growth has continued uninterrupted for the last few years in Ottawa, Montreal and Moncton.
All benchmark home categories tracked by the index returned to positive y-o-y territory in August. Two-storey single-family home prices were up most, rising 1.2% y-o-y. One-storey single family home prices rose 0.7% y-o-y, while townhouse/row and apartment unit edged up 0.3% and 0.5%, respectively.
The MLS® HPI provides the best way to gauge price trends, because averages are strongly distorted by changes in the mix of sales activity from one month to the next.
The actual (not seasonally adjusted) national average price for homes sold in August 2019 was around $493,500, up almost 4% from the same month last year.
The national average price is heavily skewed by sales in the GVA and GTA, two of Canada’s most active and expensive housing markets. Excluding these two markets from calculations cuts more than $100,000 from the national average price, trimming it to less than $393,000 and reducing the year-over-year gain to 2.7%.
– 30 –
PLEASE NOTE: The information contained in this news release combines both major market and national sales information from MLS® Systems from the previous month.
CREA cautions that average price information can be useful in establishing trends over time, but does not indicate actual prices in centres comprised of widely divergent neighbourhoods or account for price differential between geographic areas. Statistical information contained in this report includes all housing types.
MLS® Systems are co-operative marketing systems used only by Canada’s real estate Boards to ensure maximum exposure of properties listed for sale.
The Canadian Real Estate Association (CREA) is one of Canada’s largest single-industry trade associations, representing more than 130,000 REALTORS® working through 90 real estate boards and associations.
Further information can be found at http://crea.ca/statistics.
For more information, please contact:
Pierre Leduc, Media Relations
The Canadian Real Estate Association
Tel.: 613-237-7111 or 613-884-1460
E-mail: pleduc@crea.ca


Leave a Reply
Want to join the discussion?Feel free to contribute!