
Canadian home sales drop sharply in May
Ottawa, ON, June 15, 2017 – According to statistics released today by The Canadian Real Estate Association (CREA), national home sales posted a sizeable decline in May 2017.
Highlights:
- National home sales dropped 6.2% from April to May.
- Actual (not seasonally adjusted) activity in May stood 1.6% below last May’s level.
- The number of newly listed homes edged up 0.3% from April to May.
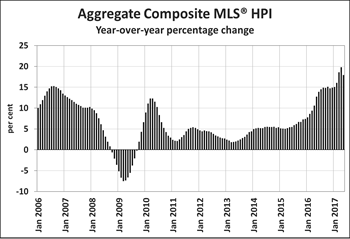
- The MLS® Home Price Index (HPI) was up 17.9% year-over-year (y-o-y) in May 2017.
- The national average sale price advanced by 4.3% y-o-y in May.
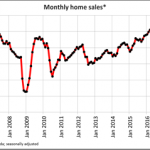
 The number of homes sold via Canadian MLS® Systems fell by 6.2% in May 2017 compared to April. The month-over-month (m-o-m) percentage decline was the largest since August 2012.
While May sales were down from the previous month in about half of all local markets, the sizeable national decline largely reflects a 25.3% m-o-m drop in the Greater Toronto Area (GTA). Activity was also down significantly from the previous month among other housing
markets across the Greater Golden Horseshoe region, including Oakville-Milton, Hamilton-Burlington and Barrie. By contrast, activity rose to multi-year highs in Montreal and Quebec City.
Actual (not seasonally adjusted) activity was down 1.6% on a year-over-year basis in May, with year-over-year (y-o-y) gains in about 60% of all local housing markets offset by the sharp drop in the GTA (20.8% y-o-y). Calgary, Edmonton, Ottawa and Montreal were among a number of urban centres where May sales surpassed year-ago levels.
“Recent changes to housing policy in Ontario have quickly caused sales and listings to become more balanced in the GTA,” said CREA President Andrew Peck. “Meanwhile, the balance between supply and demand in Vancouver is tightening up, while many places elsewhere in Canada remain amply supplied. All real estate is local, and REALTORS® remain your best source for information about sales and listings where you live or might like to.”
“This is the first full month of results since changes to Ontario housing policy made in late April. They provide clear evidence that the changes have resulted in more balanced housing markets throughout the Greater Golden Horseshoe region,” said Gregory Klump, CREA’s Chief Economist. “For housing markets in the region, May sales activity was down most in the GTA and Oakville. This suggests the changes have squelched speculative home purchases.”
The number of newly listed homes edged up a further 0.3% in May following April’s jump of almost 10%. New listings in May remained high in and around the GTA; however, the York Region of the GTA posted the largest month-over-month decline in new supply. Similar percentage declines were also evident for new listings in Oakville-Milton and Barrie.
With sales down considerably in May, the national sales-to-new listings ratio moved out of sellers’ territory and back into balanced market territory for the first time since late 2015. The ratio stood at 56.3% in May 2017, down from 60.2% in April and the high-60% range over the first three months of this year.
A sales-to-new listings ratio between 40 and 60 is generally consistent with balanced housing market conditions, with readings below and above this range indicating buyers’ and sellers’ markets respectively.
The ratio was above 60% in more than half of all local housing markets in May, the majority of which are located in British Columbia and southwestern Ontario. The ratio is above 70% for Greater Vancouver and the Fraser Valley and above 60% for Montreal. By contrast, the ratio softened sharply in the GTA, closing out the month at 41%.
The number of months of inventory is another important measure of the balance between housing supply and demand. It represents how long it would take to completely liquidate current inventories at the current rate of sales activity.
There were 4.7 months of inventory on a national basis at the end of May 2017, up from 4.3 months in April and 4.1 months in March. This returns the measure to where it was for much of 2016.
With new listings having surged and sales having declined in some markets within the Greater Golden Horseshoe, the number of months of inventory in the region is up from all-time lows. That said, housing markets in the region remain among the tightest in Canada, with most urban centres in the region still registering less than two months of inventory.
 The Aggregate Composite MLS® HPI rose by 17.9% y-o-y in May 2017 compared to 19.8% in April. Price gains slowed sharply for single family homes.
Price gains accelerated for apartment units, which posted the largest y-o-y gains in May (+20.5%). Meanwhile, prices gains braked for benchmark low-rise homes (townhouse/row units: +19.3% y-o-y; two-storey single family homes: +18.4% y-o-y; one-storey single family homes: +14.5% y-o-y).
While benchmark home prices were up from year-ago levels in 11 of 13 housing markets tracked by the MLS® HPI, price trends continued to vary widely by location.
After having dipped in the second half of last year, home prices in the Lower Mainland of British Columbia have been recovering and have either reached new heights or are trending toward them (Greater Vancouver: +8.8% y-o-y; Fraser Valley: +14.7% y-o-y). Meanwhile, y-o-y benchmark home price increases remained in the 20% range in Victoria and elsewhere on Vancouver Island.
Price gains slowed on a y-o-y basis in Greater Toronto and particularly in Oakville-Milton but remain well above year-ago levels (Greater Toronto: +29% y-o-y; Oakville-Milton: +23.9% y-o-y). Price growth remained in the mid-20% on a y-o-y basis in Guelph.
Calgary and Regina traded places in May, with Calgary prices having posted the first y-o-y gain (+0.2%) in almost two years and Regina prices having moved into negative territory (-1.7%) for the first time since January 2016. Saskatoon home prices remained down from year-ago levels (-2.8%) for the 22nd consecutive month.
Benchmark home prices rose by more than the rate of overall consumer price inflation in Ottawa (+4.4% overall, led by a 5.4% increase in two-storey single family home prices), Greater Montreal (+3.6% overall, led by a 4.6% increase in two-storey single family home prices) and Greater Moncton (+6.1% overall, led by a 13.1% increase in prices for townhouse/row units).
The MLS® Home Price Index (MLS® HPI) provides the best way of gauging price trends because average price trends are prone to being strongly distorted by changes in the mix of sales activity from one month to the next.
The actual (not seasonally adjusted) national average price for homes sold in May 2017 was $530,304, up 4.3% from where it stood one year earlier.
The national average price continues to be pulled upward by sales activity in Greater Vancouver and Greater Toronto, which are two of Canada’s most active and expensive housing markets. Excluding these two markets from calculations trims more than $130,000 from the national average price ($398,546).
– 30 –
PLEASE NOTE: The information contained in this news release combines both major market and national sales information from MLS® Systems from the previous month.
CREA cautions that average price information can be useful in establishing trends over time, but does not indicate actual prices in centres comprised of widely divergent neighbourhoods or account for price differential between geographic areas. Statistical information contained in this report includes all housing types.
MLS® Systems are co-operative marketing systems used only by Canada’s real estate Boards to ensure maximum exposure of properties listed for sale.
The Canadian Real Estate Association (CREA) is one of Canada’s largest single-industry trade associations, representing more than 120,000 REALTORS® working through some 90 real estate Boards and Associations.
Further information can be found at http://crea.ca/statistics.
For more information, please contact:
Pierre Leduc, Media Relations
The Canadian Real Estate Association
Tel.: 613-237-7111 or 613-884-1460
E-mail: pleduc@crea.ca

Leave a Reply
Want to join the discussion?Feel free to contribute!